

Point: The ISL99360FRZ-T headlines are immediately relevant to high-current point-of-load designs.
Evidence: The vendor datasheet lists a 60 A continuous output rating, a 3.0–16 V input range, and a 32‑PQFN (5 × 5 mm) package.
Explanation: Those specs indicate a compact, high-current module suited to server/compute rails and dense point‑of‑load systems where board area and thermal management are critical.
Point: This article’s purpose is practical spec-driven selection.
Evidence: Analysis is grounded in published device parameters and typical lab validation items.
Explanation: Engineers will get application-focused guidance—what to verify on the bench, layout priorities, and when the device fits a design target—so evaluation time is reduced and risk is minimized.
1 — Product overview and positioning (background)
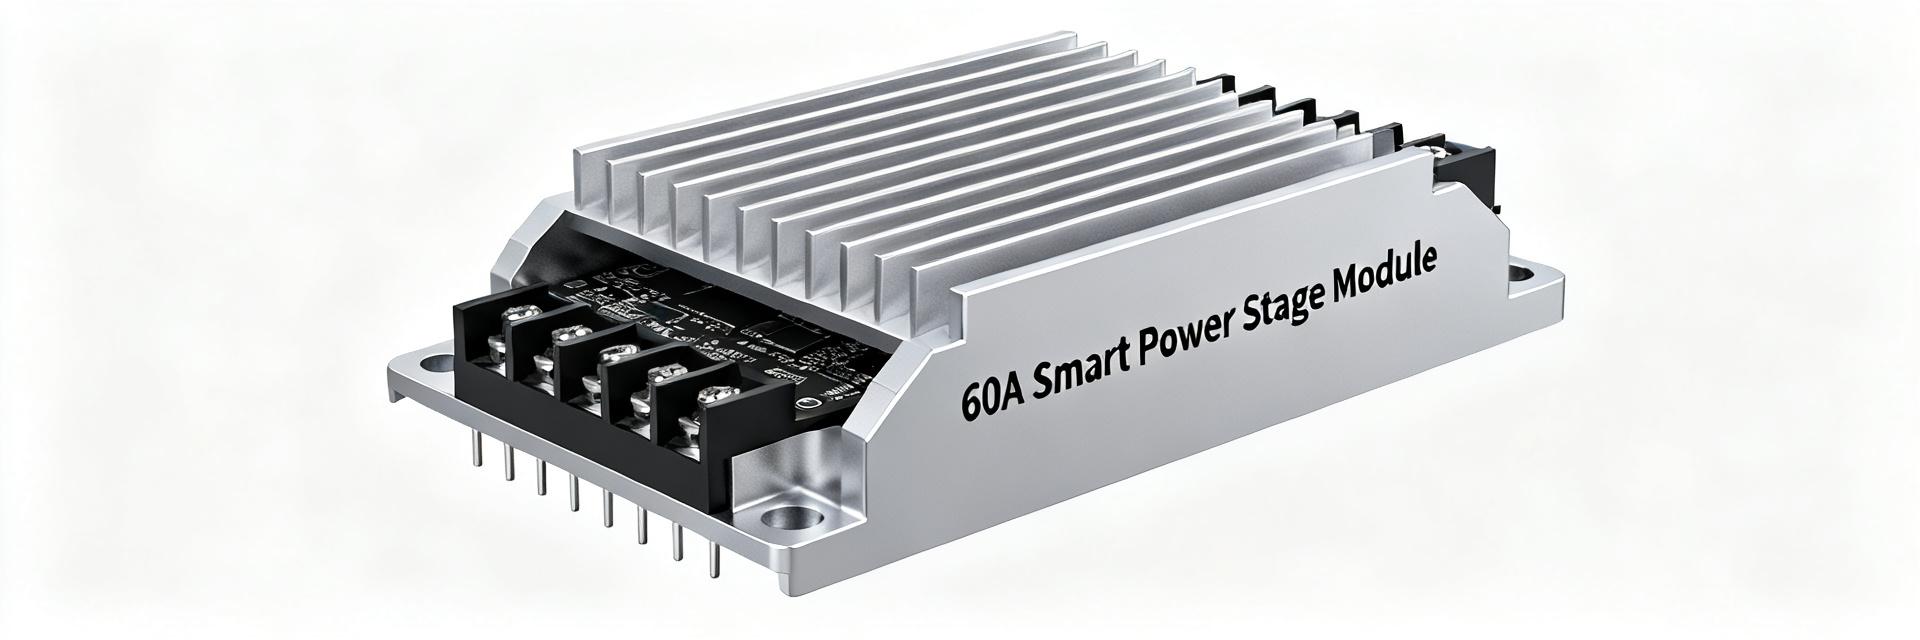
1.1 — What the ISL99360FRZ-T is (device family & Gen2 SPS concept)
Point: The device is a smart power stage that integrates MOSFETs, gate drive, and monitoring.
Evidence: The vendor datasheet characterizes it as a Gen‑style SPS with built‑in telemetry and protection.
Explanation: Integration reduces component count and layout complexity, helps meet tight transient specs, and offloads monitoring tasks from the system controller.
1.2 — Typical target applications and topology fit
Point: Target use cases are power‑dense, high‑current rails.
Evidence: Datasheet ratings and package size align to server VRMs, telecom point‑of‑load, and GPU auxiliary rails.
Explanation: The stage is optimized for single‑phase up to 60 A or parallelized multi‑phase arrays where phases are synchronized for current sharing and reduced ripple.
2 — Electrical specifications deep-dive: power, voltage, and package (data analysis)
| Parameter | Value / Spec Range | Application Significance |
|---|---|---|
| Input Voltage Range (VIN) | 3.0V to 16.0V | Supports standard 5V and 12V intermediate bus rails |
| Continuous Output Current (IOUT) | 60 A | High-current density capability for compute cores |
| Package Footprint | 32-PQFN (5mm x 5mm) | Extremely small board footprint; requires careful thermal layout |
| Integrated Telemetry | IMON (Current), TMON (Temp) | Provides real-time system feedback, eliminating external shunts |
2.1 — DC electrical ratings: operating voltage, max output current, and output-range implications
Point: The 3.0–16 V input window defines compatibility and derating behavior.
Evidence: Vendor spec lists that full conduction is supported across that range with a 60 A continuous rating at defined thermal conditions.
Explanation: Designers must map that 60 A to PCB thermal constraints—check derating curves, ambient, and airflow to ensure continuous operation without thermal throttling.
2.2 — Package, pinout, and thermal resistance (θJA/θJC considerations)
Point: The 32‑PQFN 5×5 mm package yields high power density and thermal challenges.
Evidence: Datasheet thermal tables show θJA influenced strongly by PCB copper and via count.
Explanation: Optimize board copper, add thermal vias under exposed pad, and follow vendor pad recommendations to limit junction rise at high current; expect forced airflow or significant inner copper for sustained 60 A.
3 — Dynamic performance and switching characteristics (data analysis)
3.1 — Switching speed, dead time, and efficiency trade-offs
Point: Switching losses depend on MOSFET RDS(on), gate charge, and chosen frequency.
Evidence: Datasheet gives RDS(on) and Qg specs that imply tradeoffs between conduction and switching loss.
Explanation: Lower RDS(on) improves light‑load efficiency, but higher gate charge increases switching loss; choose switching frequency to balance size and efficiency while tuning dead time to avoid shoot‑through or diode conduction loss.
3.2 — Measurables to verify (efficiency curves, transient response, inductor selection impact)
Point: Specific plots are essential to validate claims.
Evidence: Vendors provide efficiency vs. Iout and transient response examples; these should be reproduced.
Explanation: Measure Iout vs efficiency across duty cycles, evaluate load‑step recovery, and select inductor L and DCR to meet ripple and transient targets—lower DCR favors efficiency but may worsen transient damping.
4 — Integrated telemetry and protection features (method / spec breakdown)
4.1 — Current and temperature monitoring: accuracy, interface, and use cases
Point: Built‑in telemetry enables system monitoring and phase balancing.
Evidence: The datasheet describes on‑die current/temperature sensing and an interface for telemetry.
Explanation: Use telemetry for current sharing, fault logging, and thermal management; validate accuracy on bench with calibrated shunt and thermocouple comparisons across the operating range.
4.2 — Protection mechanisms and fault behavior (OCP, OVP, UVLO, thermal shutdown)
Point: Multiple protections are implemented with programmable or fixed responses.
Evidence: Datasheet lists OCP, OVP, UVLO, and thermal shutdown behaviors with stated thresholds and modes.
Explanation: Determine whether faults latch or autoretry; design system sequencing and fault-handling logic to avoid unintended recoveries or stress during power cycles.
5 — PCB layout, gate-drive, and thermal best practices (method / implementation)
5.1 — Power loop optimization, decoupling placement, and ground strategy
Point: Minimizing parasitic loop inductance is critical at 60 A.
Evidence: Vendor layout recommendations emphasize short loops and close decoupling.
Explanation: Place bulk and high‑frequency decoupling close to the stage, route VIN‑SW‑VOUT loops with wide copper, and use a solid return plane with stitched vias to reduce impedance and EMI.
5.2 — Gate drive tuning, soft-start, and thermal mitigation techniques
Point: Gate path and soft‑start settings control inrush and EMI.
Evidence: Datasheet notes gate characteristics and available soft‑start options.
Explanation: Verify Kelvin gate sense, add driver bypass caps, program soft‑start to limit inrush at startup, and use thick outer copper plus thermal vias or airflow for reliable thermal dissipation.
6 — Validation checklist, example application, and selection guidance (case + action)
6.1 — Bench test checklist: must-measure items to confirm the spec
Point: A prioritized test list shortens validation time.
Evidence: Typical test procedures map directly to datasheet claims (Iout, efficiency, thermal).
Explanation: Measure DC current capability, efficiency sweep at multiple VIN/VOUT points, load‑step transient, thermal imaging at peak load, telemetry accuracy, and exercise protection thresholds; use pass/fail criteria tied to datasheet margins.
6.2 — When to choose ISL99360FRZ-T vs alternatives (practical decision flow)
Point: Selection depends on current, telemetry, and thermal envelope.
Evidence: Compare required continuous current, monitoring needs, board area, and switching frequency to the device’s spec set.
Explanation: Choose the module for single‑phase 60 A server VRMs or phase‑parallel point‑of‑load arrays when telemetry and compact package reduce system complexity; otherwise evaluate alternatives with lower RDS(on) or different package thermal performance.
Summary
Point: Verdict and top engineering takeaways are concise.
Evidence: The device’s 60 A rating, 3.0–16 V input window, and 5×5 mm 32‑PQFN package support high‑current point‑of‑load use.
Explanation: ISL99360FRZ-T fits dense server and compute rails when thermal layout, telemetry validation, and protection behavior are properly addressed.
- Thermal layout is paramount: optimize exposed pad, thermal vias, and copper to sustain 60 A continuous with acceptable junction rise.
- Telemetry is a practical benefit: use on‑die current/temp data for sharing and health monitoring after bench calibration.
- Protection behavior affects sequencing: confirm latch vs autoretry modes and integrate into system fault management and startup timing.
— FAQs
What test should verify the ISL99360FRZ-T 60A efficiency claim?
Point: Reproduce vendor efficiency curves under real conditions.
Evidence: Measure efficiency vs Iout at target VIN/VOUT points with realistic decoupling and thermal setup.
Explanation: Use calibrated DC sources, Kelvin sense, and record case/junction temperature; expect efficiency to vary with switching frequency and inductor DCR.
How to validate ISL99360FRZ-T thermal layout recommendations?
Point: Thermal imaging under sustained load exposes hot spots.
Evidence: Vendor thermal notes tie θJA to copper area and via count.
Explanation: Run the stage at 60 A for extended intervals, capture junction proxy temps, iterate copper thickness/via count, and confirm with thermocouples and infrared imaging.
What bench steps confirm ISL99360FRZ-T telemetry accuracy?
Point: Compare on‑die telemetry to calibrated measurements.
Evidence: Datasheet provides expected accuracy ranges for current and temperature sensing.
Explanation: Use a precision shunt and thermocouple to create reference data, log telemetry output across load and temperature, and quantify offsets and linearity for system compensation.
How should the ISL99360FRZ-T protection mechanisms and fault responses be validated on the bench?
Point: Test latch-up and recovery behaviors under fault conditions.
Evidence: System responses to programmable OCP, OVP, and thermal shutdown thresholds.
Explanation: Induce controlled overcurrent or overtemperature states on the bench to verify if the device latches off or auto-retries, ensuring system sequencing works reliably without damage.